
Appearance
Home Dashboard
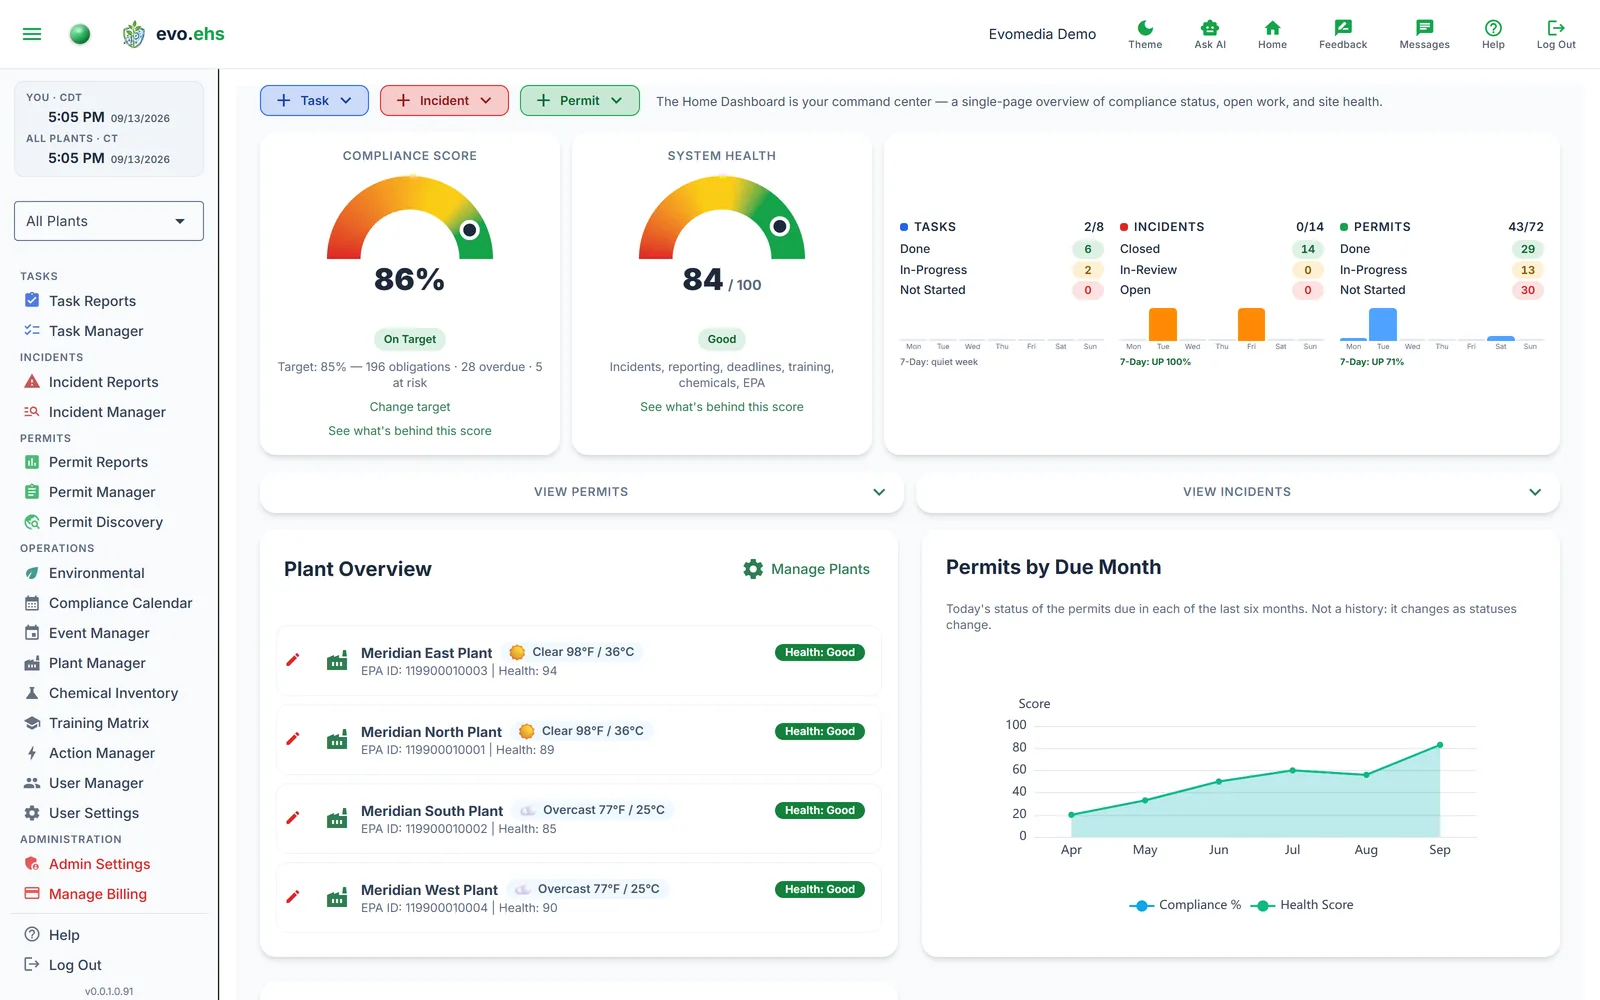 The Home Dashboard is your command center — a single-page overview of compliance status, open work, and site health.
Quick-Create Buttons
Three buttons at the top — + Task, + Incident, and + Permit — let you jump straight into creating a record without leaving the dashboard. They appear on every page, anchored to the same side of the screen as your menu (see Menu Position in Personal Settings).
Each form validates its required fields (marked with *) when you click Create, and Cancel closes the form without saving. Dates are picked from a calendar — the Permit form takes a single Due Date, and the Incident form's Occurred and Discovered fields open a combined calendar-and-clock picker (or just type the date and it formats as you go).
Use the Font size buttons (A− A+) at the top-left of an open form to grow or shrink it. The size is remembered for you — across sessions and devices — and the Guided Setup card uses the same one, so a change in either place shows up in both.
Status Cards
- Compliance Score — a gauge showing overall compliance against your permit and task load. The dial's colours come from your Compliance Target: green begins at the target, amber covers the ten points below it down to 60%, and red is everything under that. Set the target in Admin → Settings; workspaces that never set one use 95%. A marker sits at your current percentage, shown below it. A status chip reads On Target, Below Target, At Risk, or No Data Yet — and because the chip and the dial read the same target, the colour and the words always agree. The line underneath gives your target alongside the number of obligations counted, how many are overdue, and how many are at risk. The score covers every domain — permits, tasks, incident actions, regulatory reports, training, SDS reviews and audit binders — averaged within each domain and then combined, and it is capped at 59% while a regulatory report is overdue. See what's behind this score opens the Compliance Score page, which lists every domain and every obligation costing points, ranked by what to address first.
- System Health — a 0–100 score across seven components: open incidents (costing more the longer they stay open), regulatory reporting, deadline performance (the Compliance Score, once), training currency, hazard communication, and the EPA's own record of the site in two parts. It uses the same gauge as the Compliance Score, with the marker at your score and a chip reading Good, Needs Attention, or Critical. Critical runs below 40 and Good from 70 unless an administrator sets the bands differently in Admin Settings. Components with no data drop out rather than counting as perfect. See what's behind this score opens the Compliance Score page at the System Health section, which lists every component and its weight.
- Tasks / Incidents / Permits — counts broken down by status (Done, In-Progress, Not Started for tasks and permits; Closed, In-Review, Open for incidents), each with a small 7-day trend sparkline.
Below the cards, View Permits and View Incidents expand into inline lists for a closer look without navigating away.
Weather Alerts
When the National Weather Service has an alert covering one of your plants, a band appears at the top of the dashboard with one line per plant:
Heat Advisory — Meridian East Plant
NWS · in effect 12:00 PM – 8:00 PM · reported 12:39 PM (3h 08m ago)
Reading that line:
- In effect gives the hours the alert covers, in the plant's own local time. A date appears whenever a time falls on another day, so an alert running overnight reads in effect 10:00 PM – Sep 10, 6:00 AM.
- Upcoming replaces in effect when the alert has not started yet. The Weather Service often issues an advisory the evening before, and this is what tells you it is a heads-up rather than something already happening.
- Reported is when the Weather Service issued the alert, and the time in brackets is how long ago that was. A new alert for the same hazard starts its own clock, so this is the age of the alert you are reading and not of the weather generally.
Click a row to open the full advisory: severity, urgency and certainty, the affected area, the complete Weather Service text, and any instructions.
An alert disappears from the band once its end time passes, or once the Weather Service withdraws it. Alerts also appear as badges on the plant cards in Plant Manager.
Plant Overview
Lists each plant with live weather, an EPA ID (when configured), and a health badge (e.g. Health: Good, Health: Needs Attention, or Health: No Data Yet for a plant with no permits, tasks, or incidents to measure). Plants you've starred as Favorites in Plant Manager appear first. Click the pencil icon next to a plant to edit it, or Manage Plants to go to Plant Manager.
Click the health badge to see what is costing that plant its score — which components are losing it points, dearest first, then the obligations behind them, each a link to its record. It is the same panel the badge on Plant Manager opens, and everything in it belongs to that plant. Clicking anywhere else on the row still opens Plant Manager at that plant.
Permits by Due Month
A line chart with one point per month for the last six months. Each point is the Compliance % and Health Score of the permits due in that month, worked out from their status today. Read it to see which months' permits are in good shape and which are not.
It is not a history. Nothing about it is recorded month by month, so the line changes as permit statuses change, and last month's point can move today. The recorded trend is the card beside it.
Score History
The Compliance Score and System Health are recorded once a day, for the workspace and for each plant. This chart draws those records, so a point is what the two cards said on that day and does not change afterwards. The title says when the record starts; the first line appears once there are two days to draw. With the plant filter narrowed to a single plant, the chart shows that plant's own record.